The Billion-Dollar Opportunity in Medicare Part D

Why are Medicare beneficiaries paying billions more than necessary when equally effective generic alternatives exist?

Tools: Python, Pandas, Tableau Dataset: 70,000+ drug-state records (2023) Focus: Cost Savings Analysis

The Challenge

Working as a pharmacy clerk at an independent pharmacy in El Cajon, I see the same scenario play out every week: a Medicare patient hands me their prescription, I process it through their Part D plan, and their face falls when they see the copay.

"Is there a cheaper version?" they ask. Sometimes there is, a generic that works exactly the same but costs a fraction of the price. Other times, their doctor specifically wrote for the brand name, and we're stuck.

But here's what bothers me: even when generics are available, I see prescriptions come through for brand name medications that could easily be swapped. An insulin prescription that costs $800 when a $250 generic exists. An antipsychotic that runs $400 when the generic is $20. These aren't isolated cases, they're patterns.

Insurance pricing often feels like a black box. This project analyzes Medicare Part D prescriber data from 2023 to quantify exactly how much money is being left on the table, and where the biggest opportunities for savings exist.

Data & Methodology

๐Ÿ“Š

Data Source

Medicare Part D Prescriber Data (2023) from CMS covering 359 medications with both brand and generic versions across all 50 states.

๐Ÿงน

Data Processing

Aggregated 3GB raw dataset into state level and drug level analyses. Calculated generic adoption rates and potential savings scenarios.

โš™๏ธ

Feature Engineering

Created metrics for cost difference per claim, potential savings at 25% adoption improvement, and state ranking by generic utilization.

๐Ÿ“ˆ

Analysis Tools

Python (pandas, matplotlib, seaborn) for data manipulation and visualization. Tableau for interactive dashboard creation.

Key Findings

01

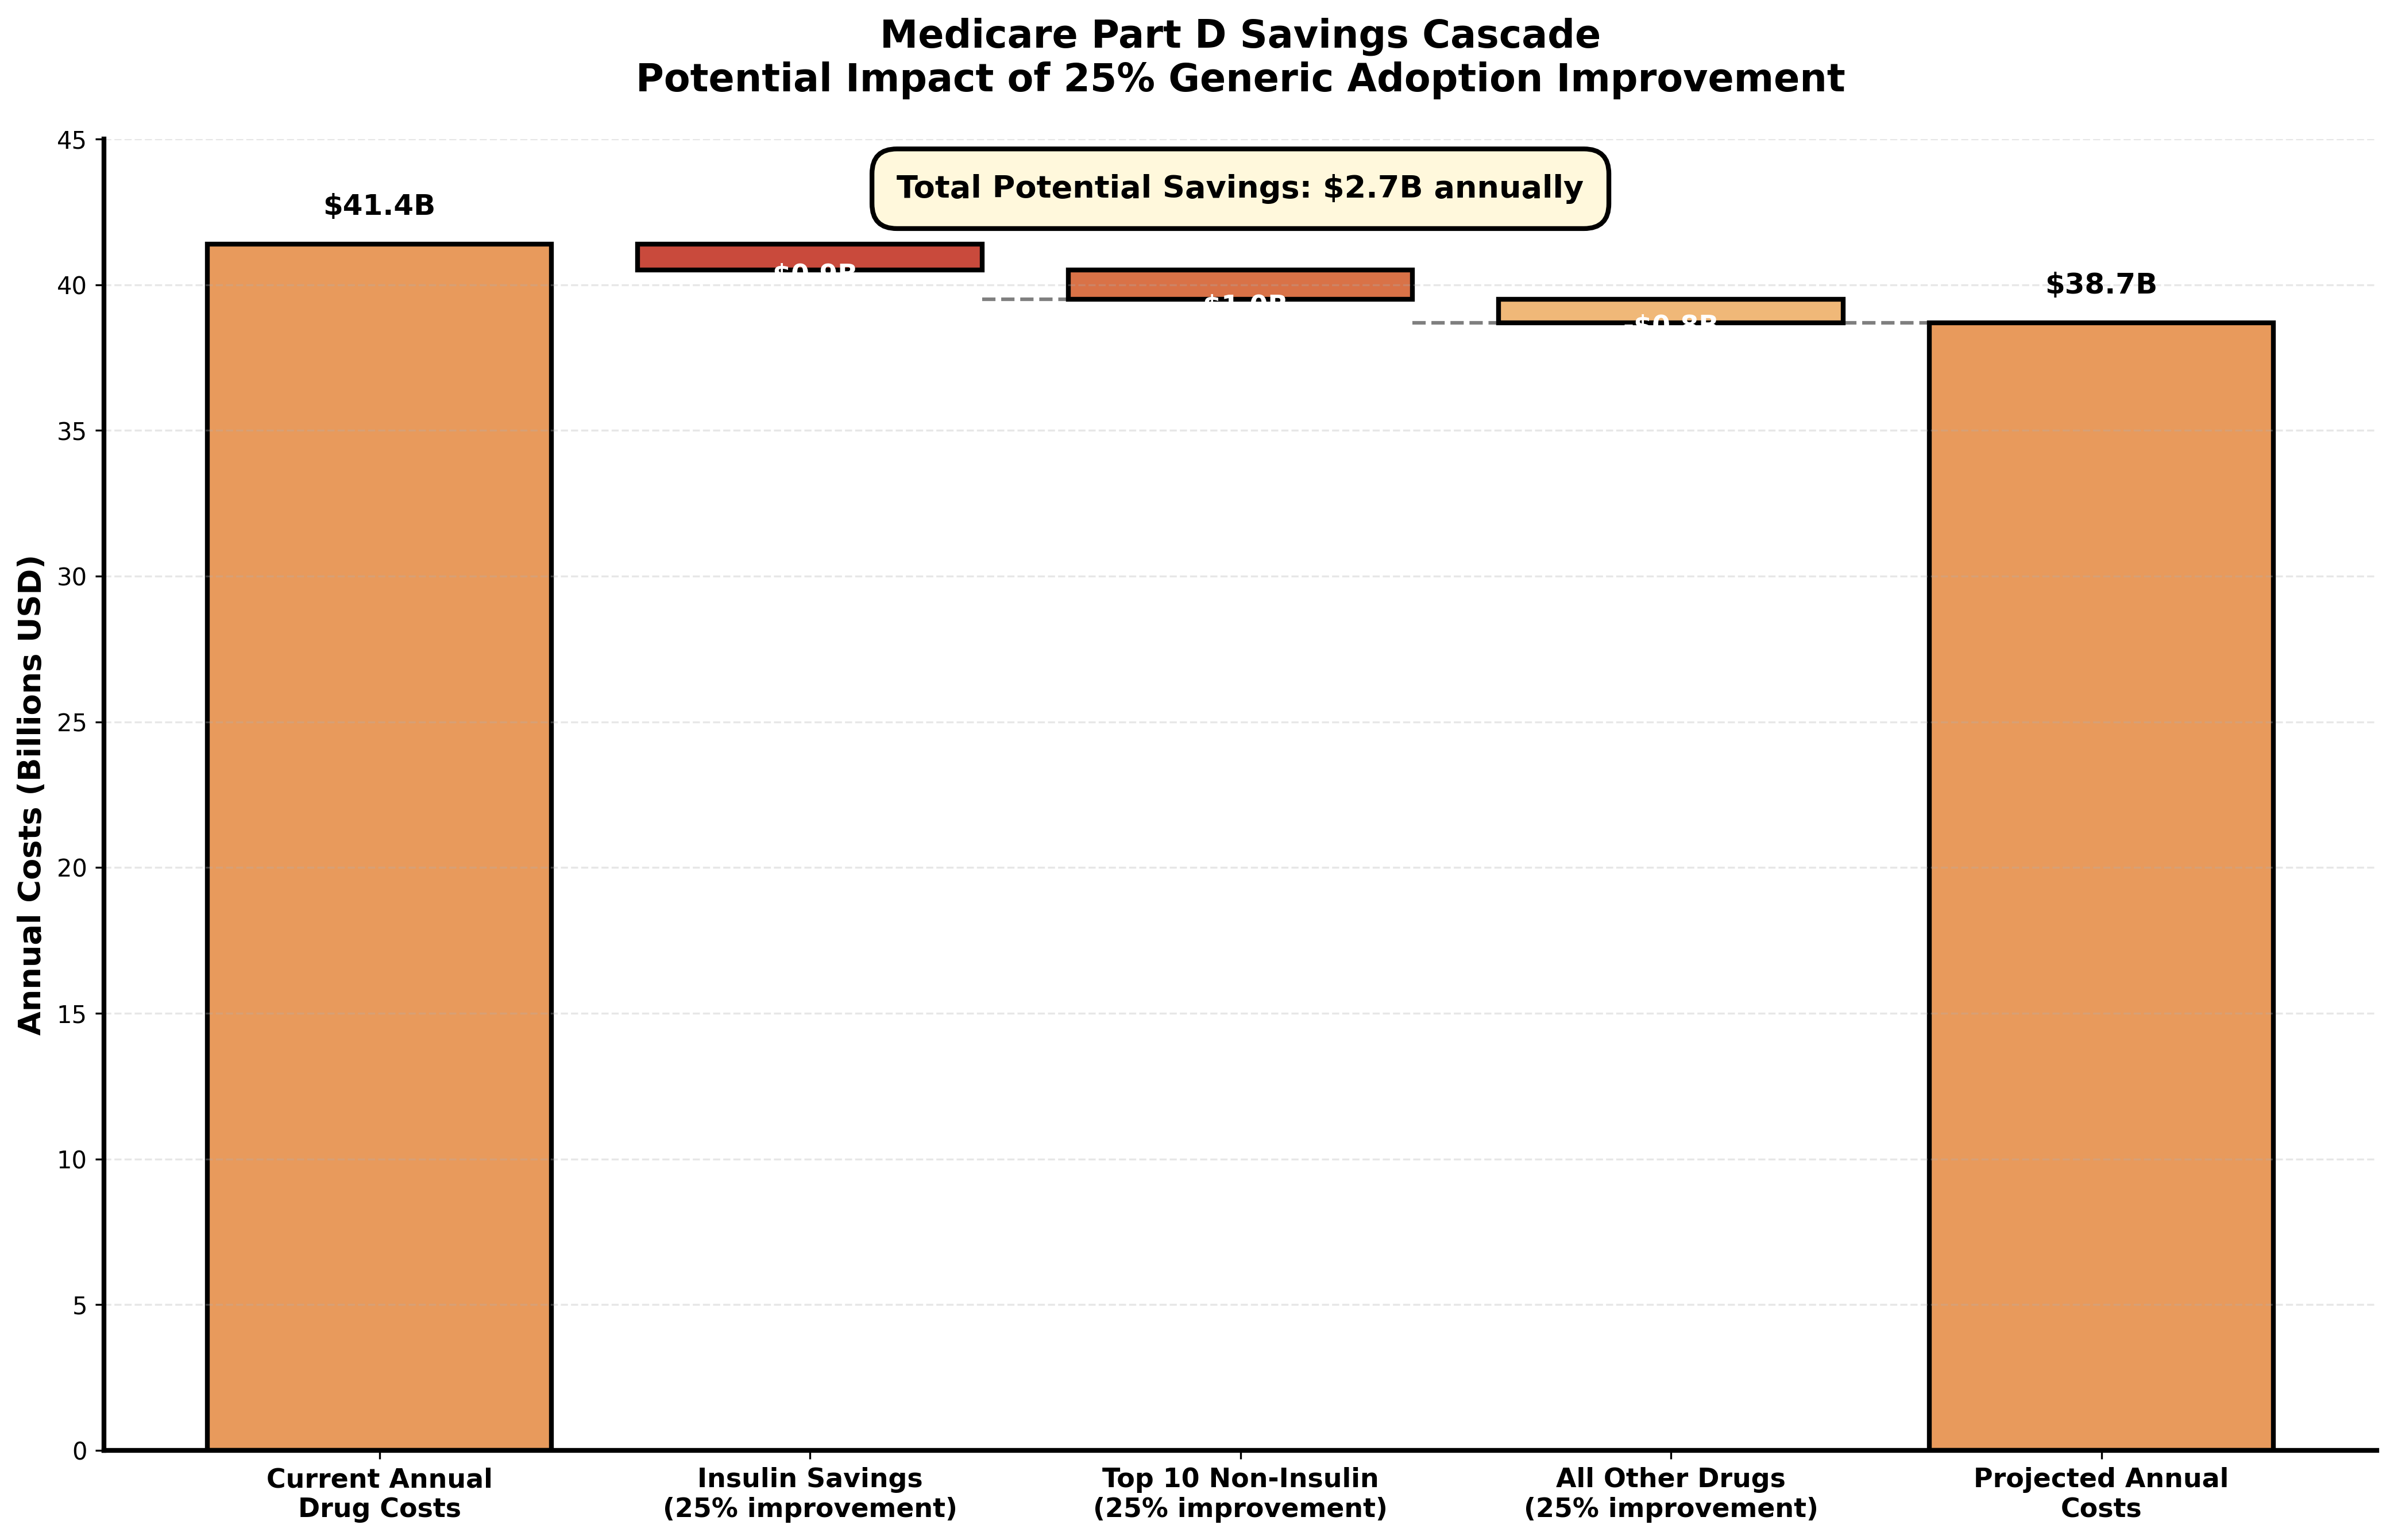
Three Insulin Products Represent $885 Million in Potential Savings

Insulin Aspart, Insulin Lispro, and Insulin Degludec showed 95 to 99% brand utilization despite available generics. These three medications alone represent the single largest savings opportunity in Medicare Part D.

99% brand usage for Insulin Aspart
$885M potential savings from insulin alone
Top 10 Medications by Savings Potential

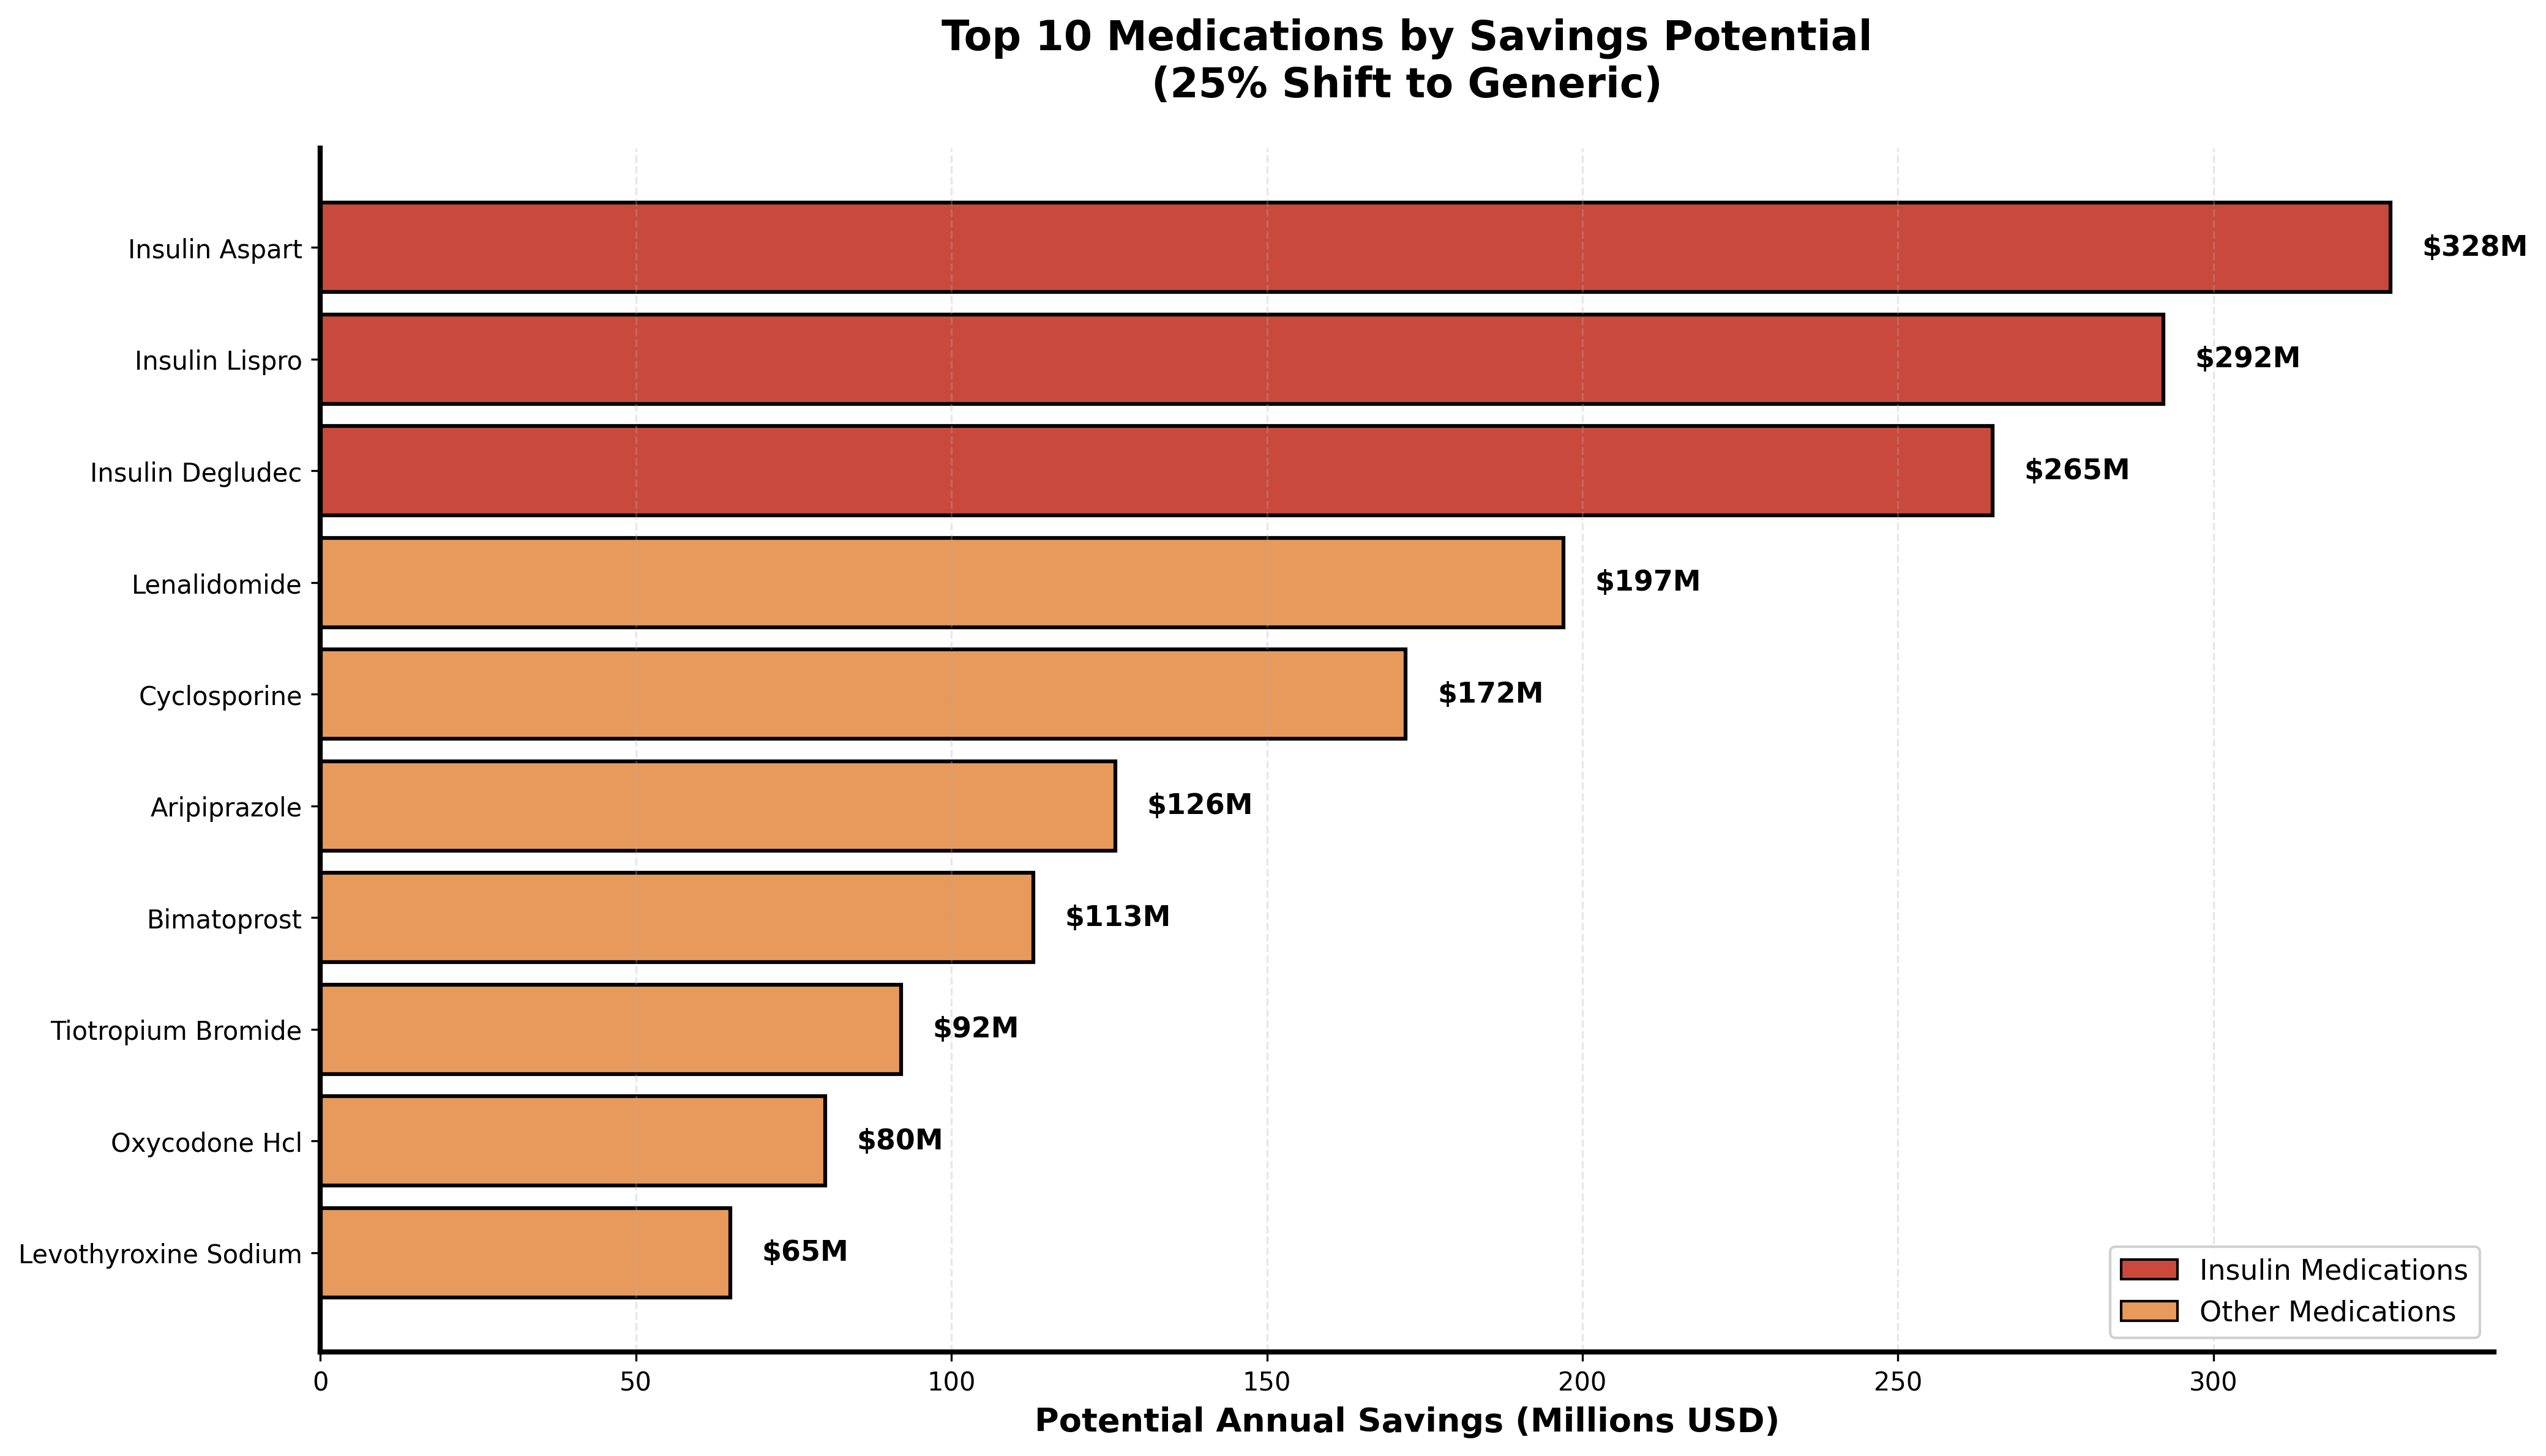
Top 10 medications ranked by potential annual savings with 25% generic adoption improvement

Cost Distribution

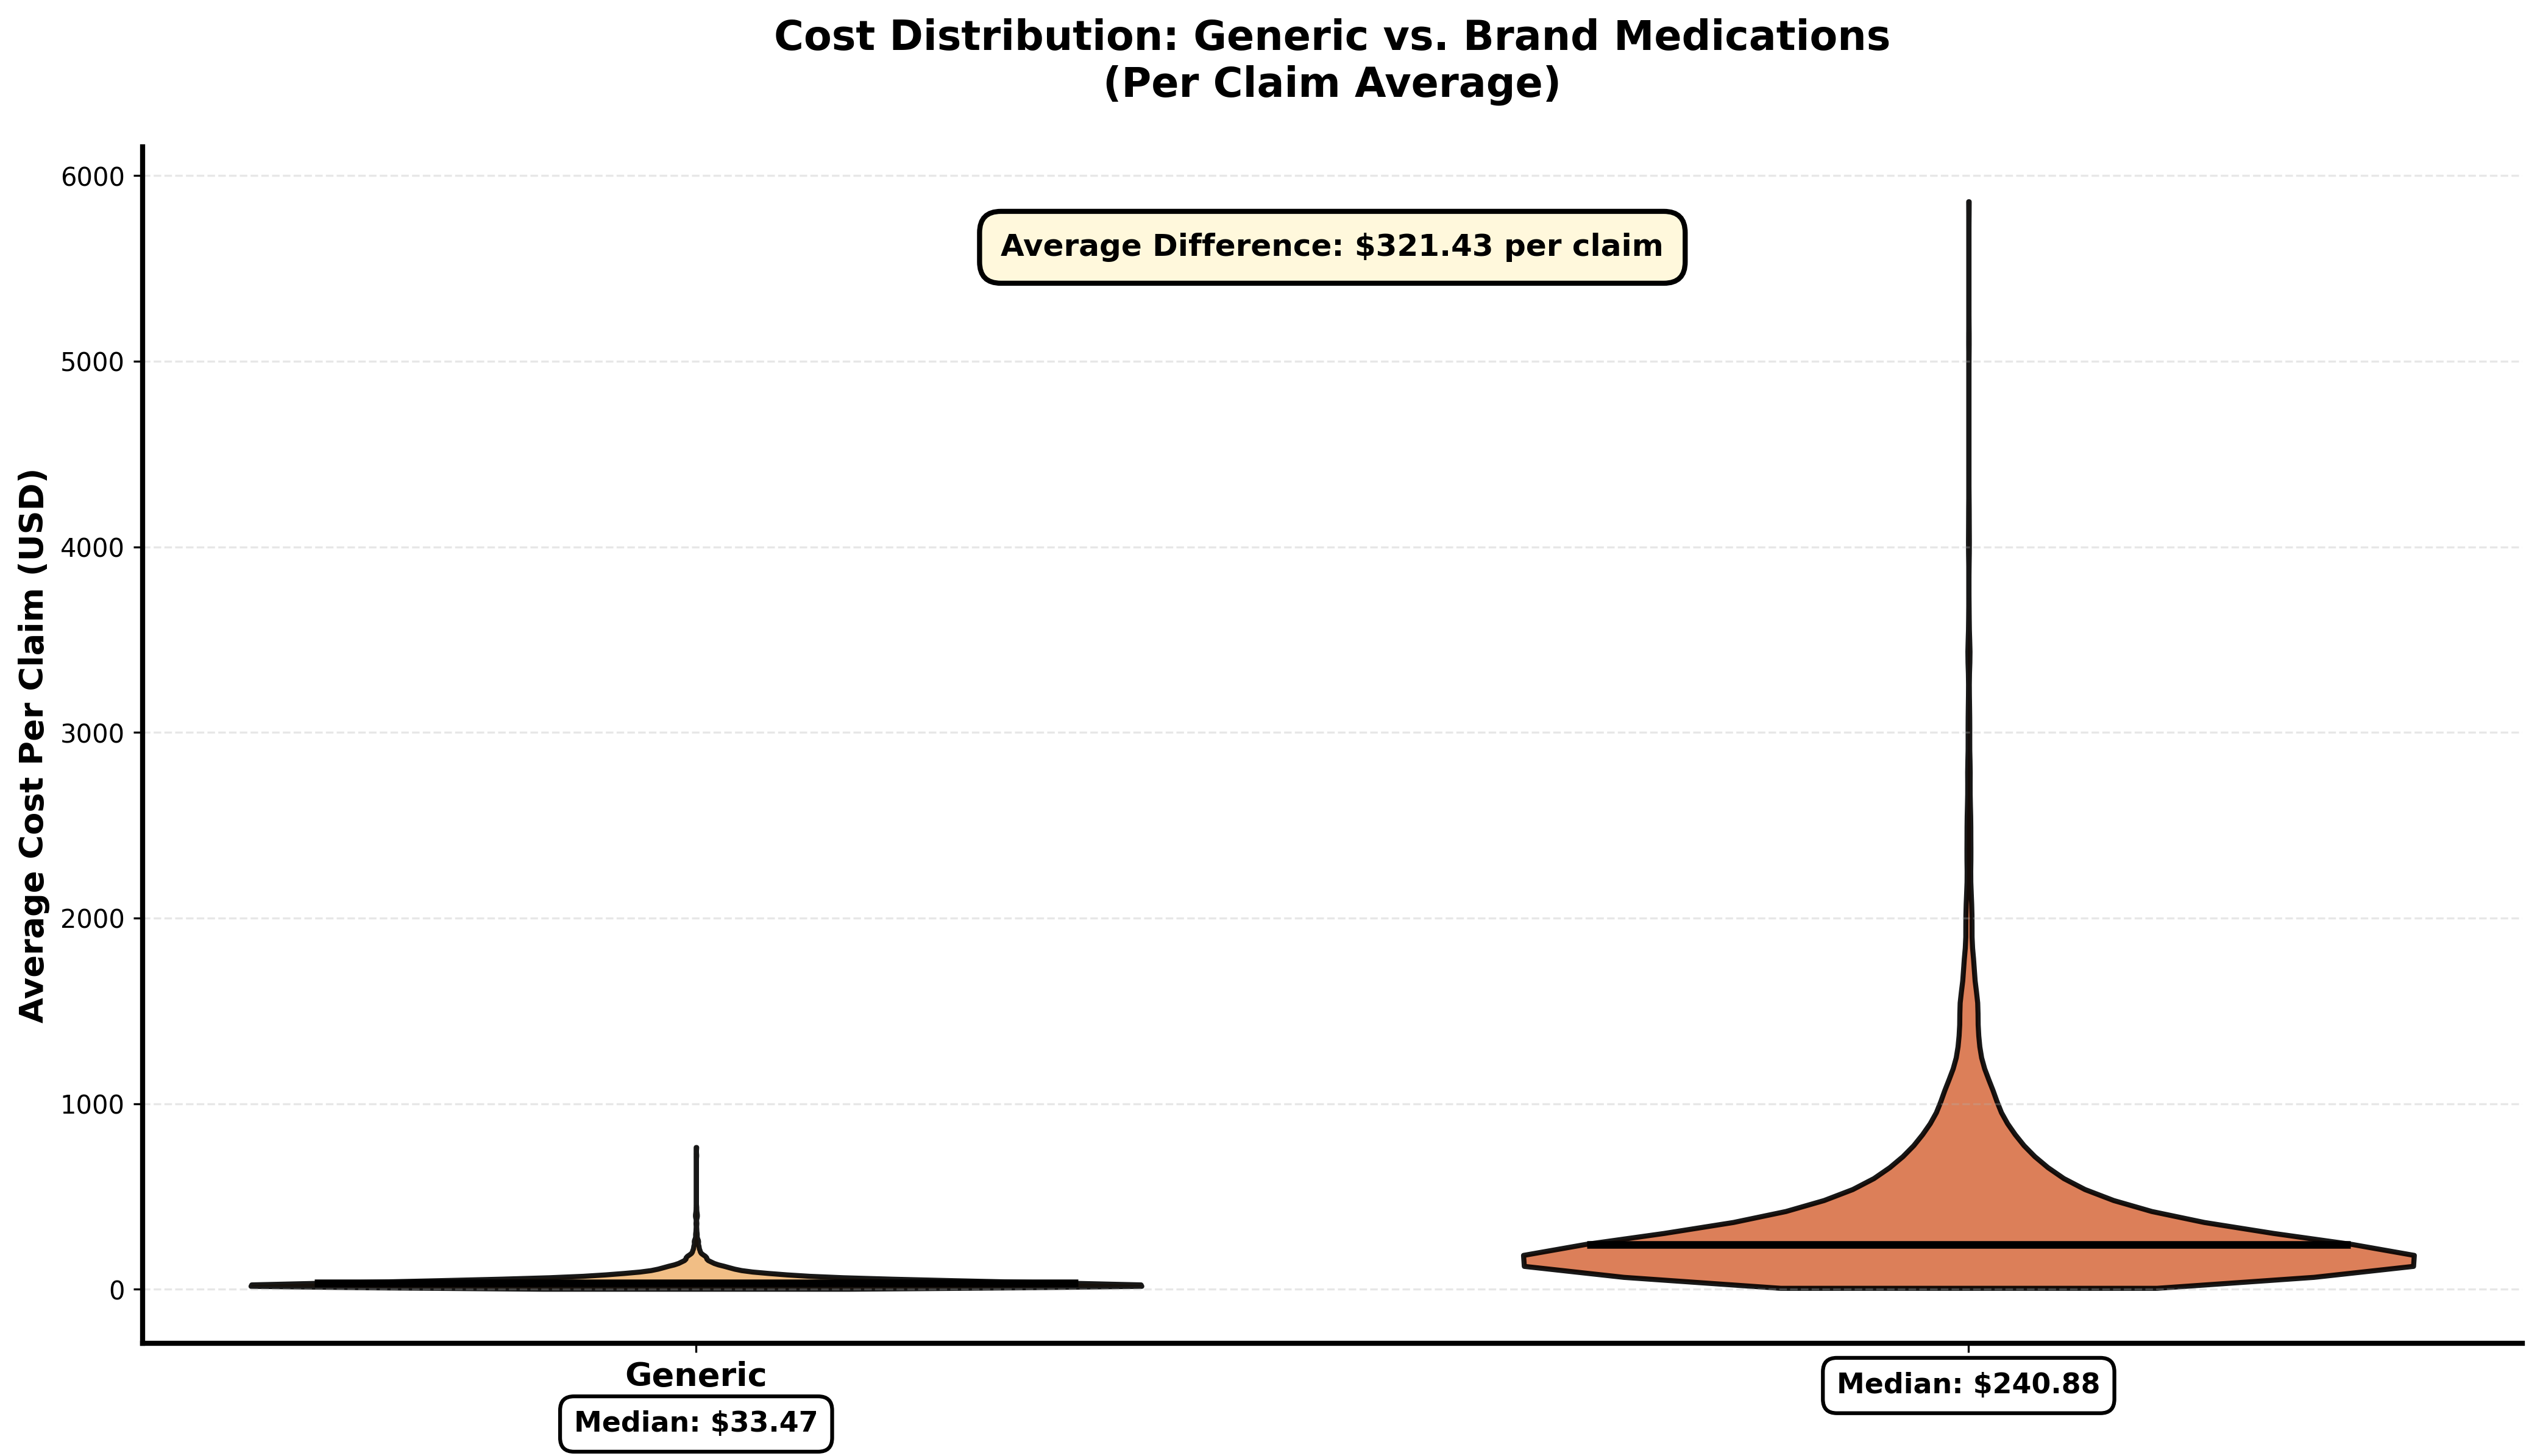
Distribution shows brand medications cost significantly more per claim than generics

Brand vs Generic Composition

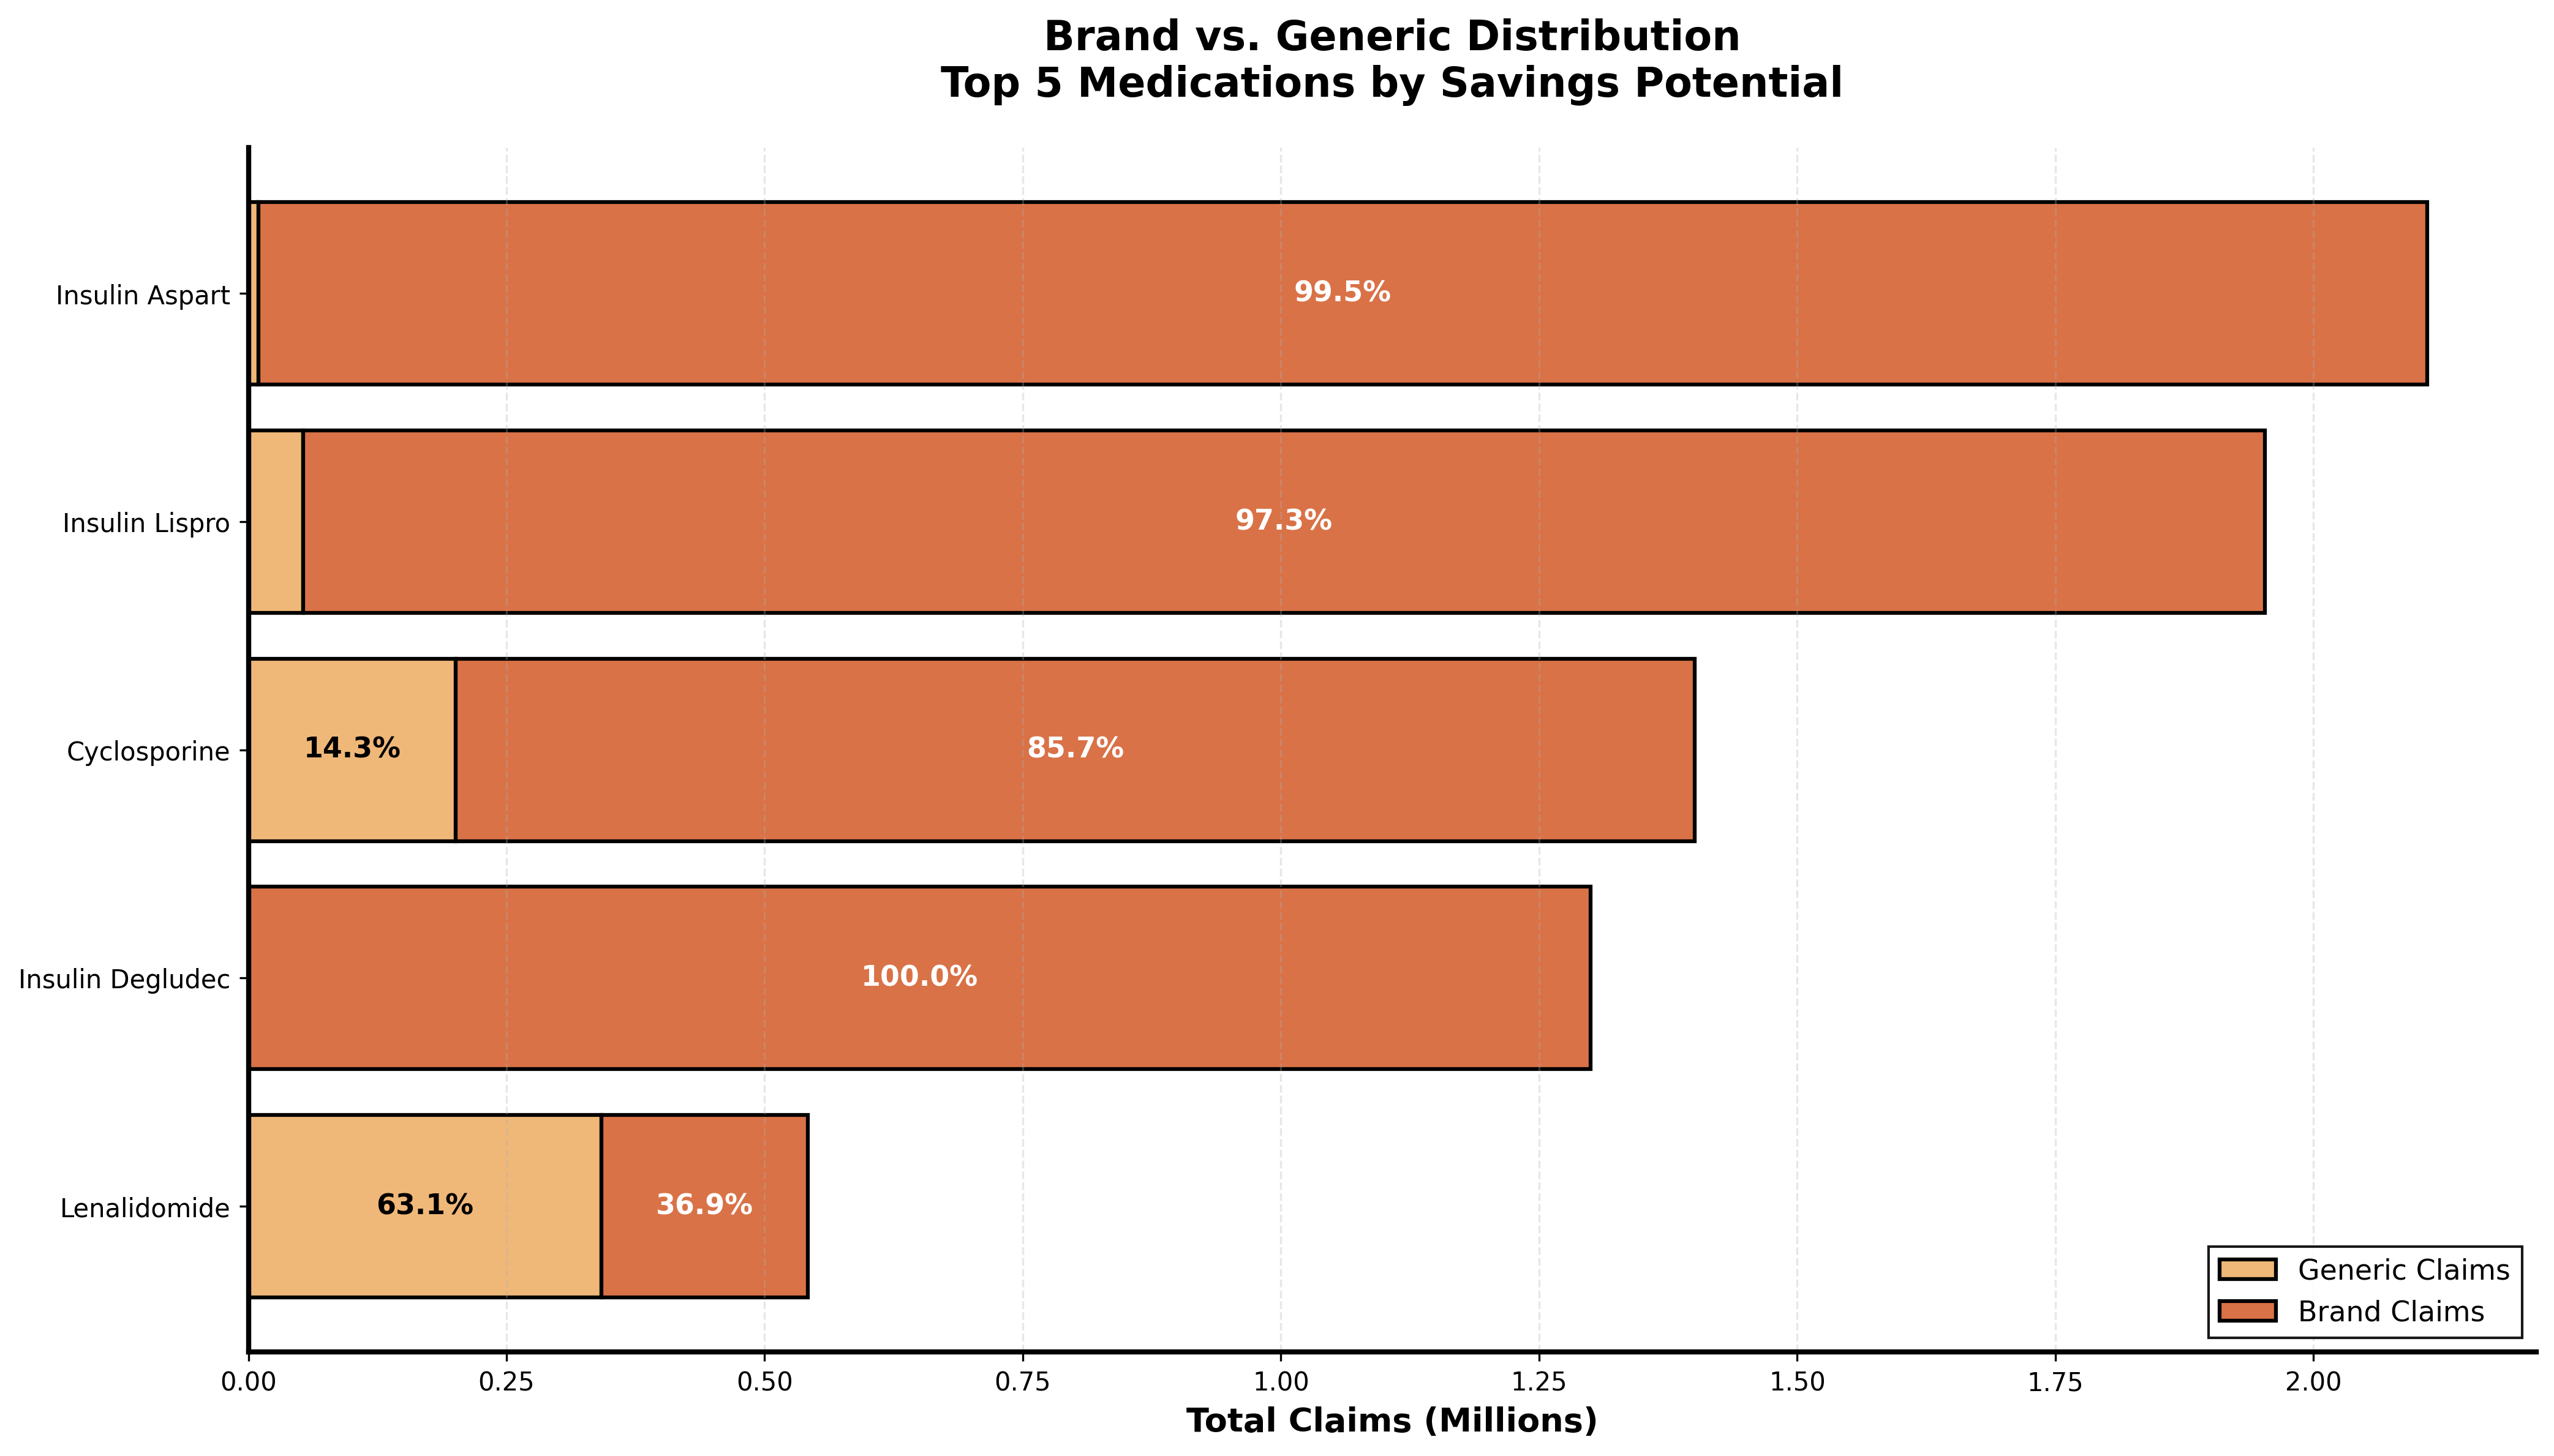
Stacked bars reveal insulin's 99% brand usage compared to better generic adoption in other drug classes

Savings Opportunity Matrix

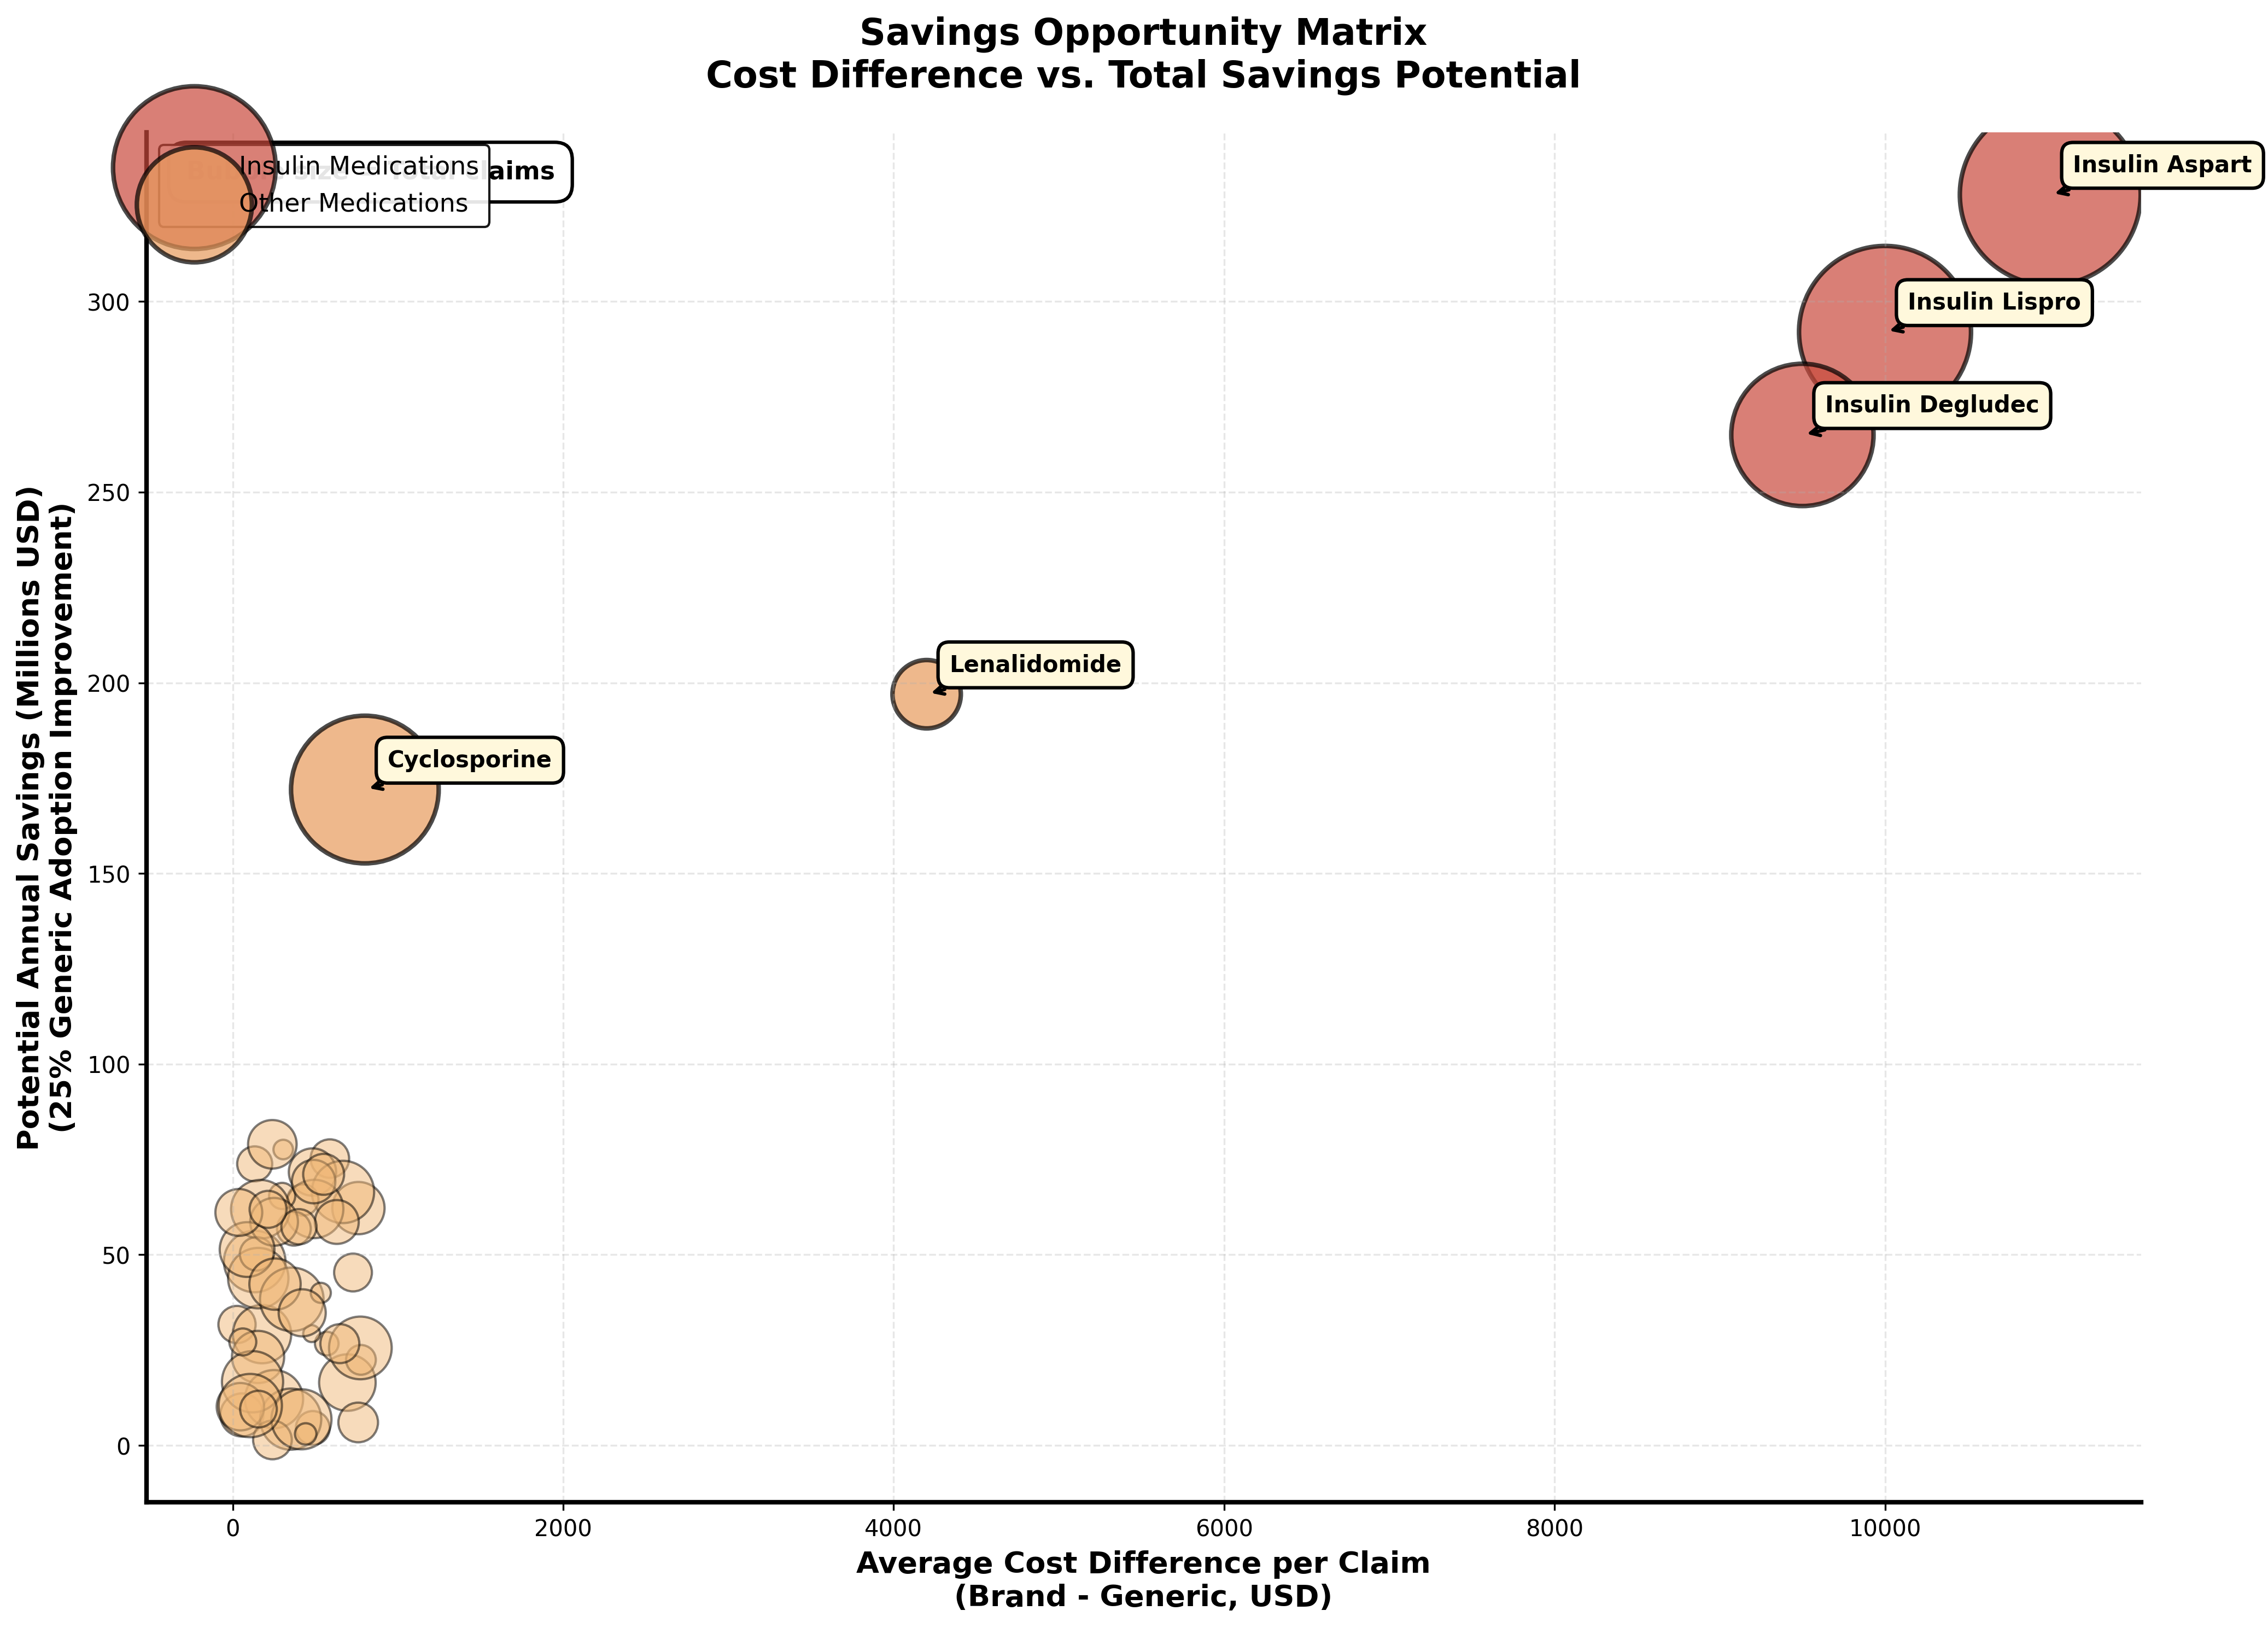
Each medication plotted by cost difference and savings potential. Insulin products cluster in the high impact quadrant.

02

Brand Dominance in High Cost Medications is Extreme

When visualizing the composition of prescriptions for top savings potential drugs, a clear pattern emerges. Insulin products show nearly complete brand dominance while other medication classes demonstrate that high generic adoption is achievable.

This isn't about generic availability. The medications exist. This is about systemic barriers preventing their use.

03

Your State Determines Your Generic Access

Generic adoption rates range from 69.7% to over 81% depending on location. This 11 percentage point spread translates to hundreds of millions in unnecessary costs and suggests the problem isn't medical necessity but regional prescribing patterns.

State Rankings

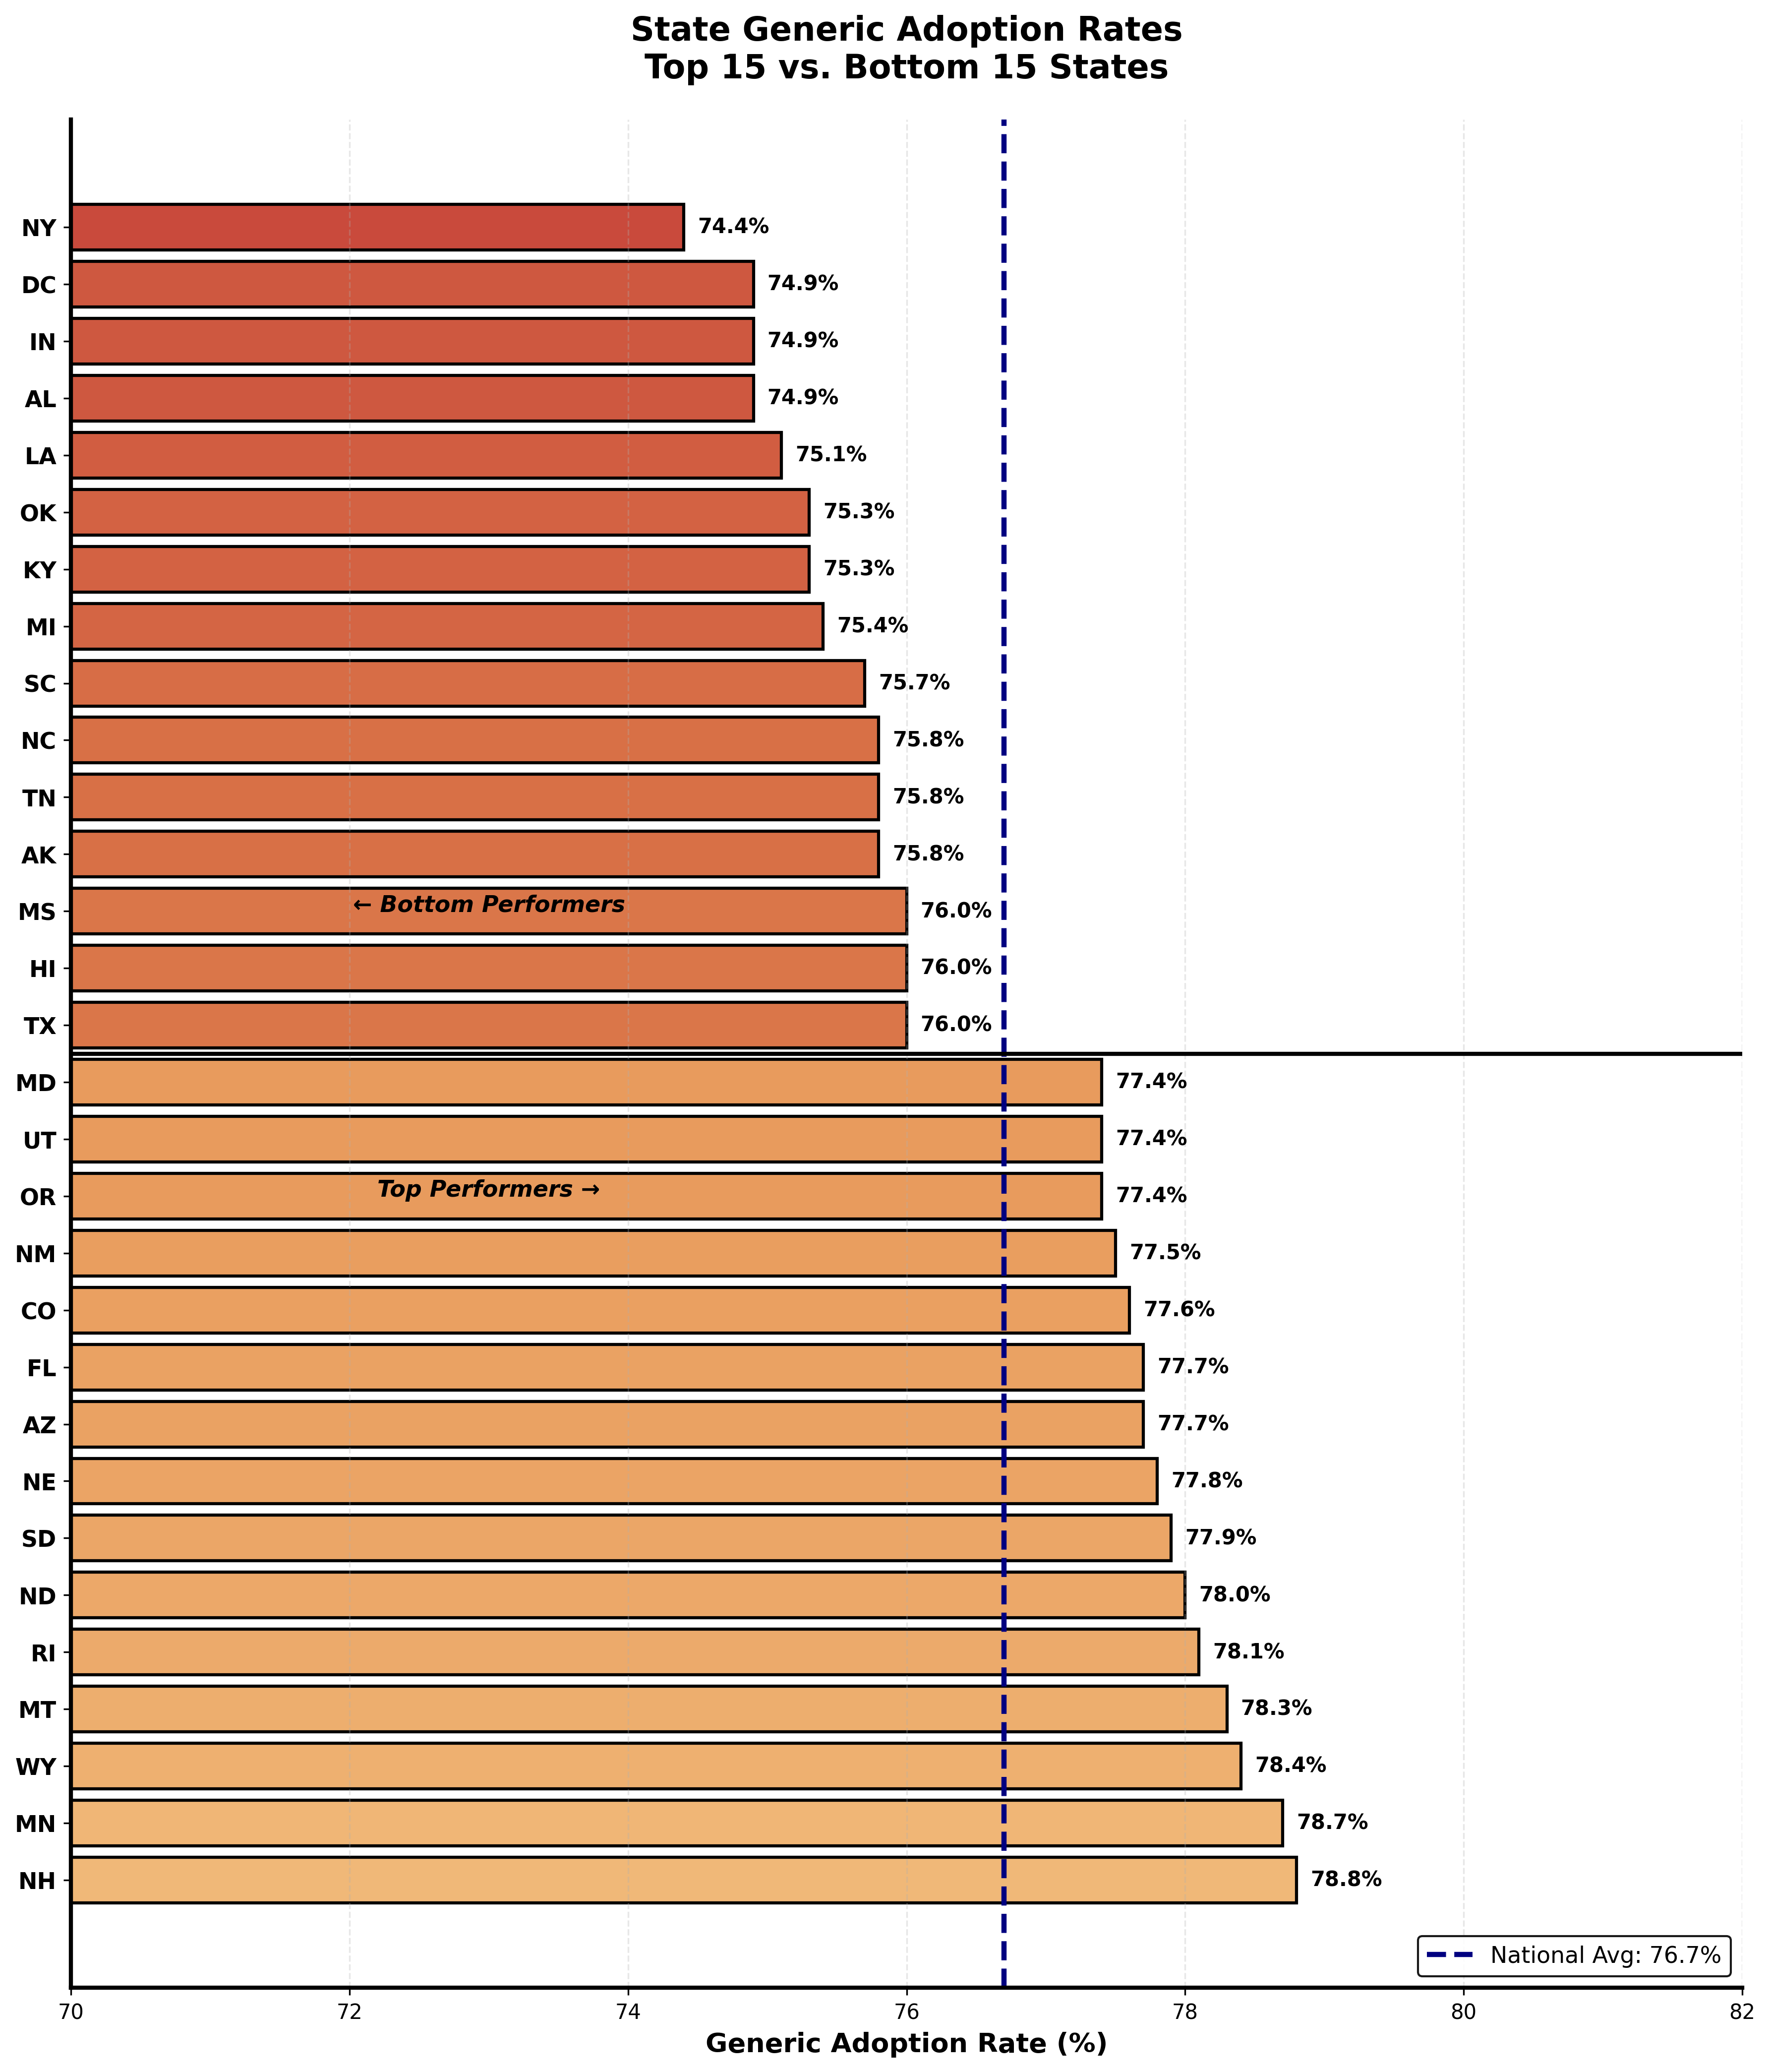
Top 15 and bottom 15 states by generic adoption rate. Geographic disparities are significant.

State Opportunity Analysis

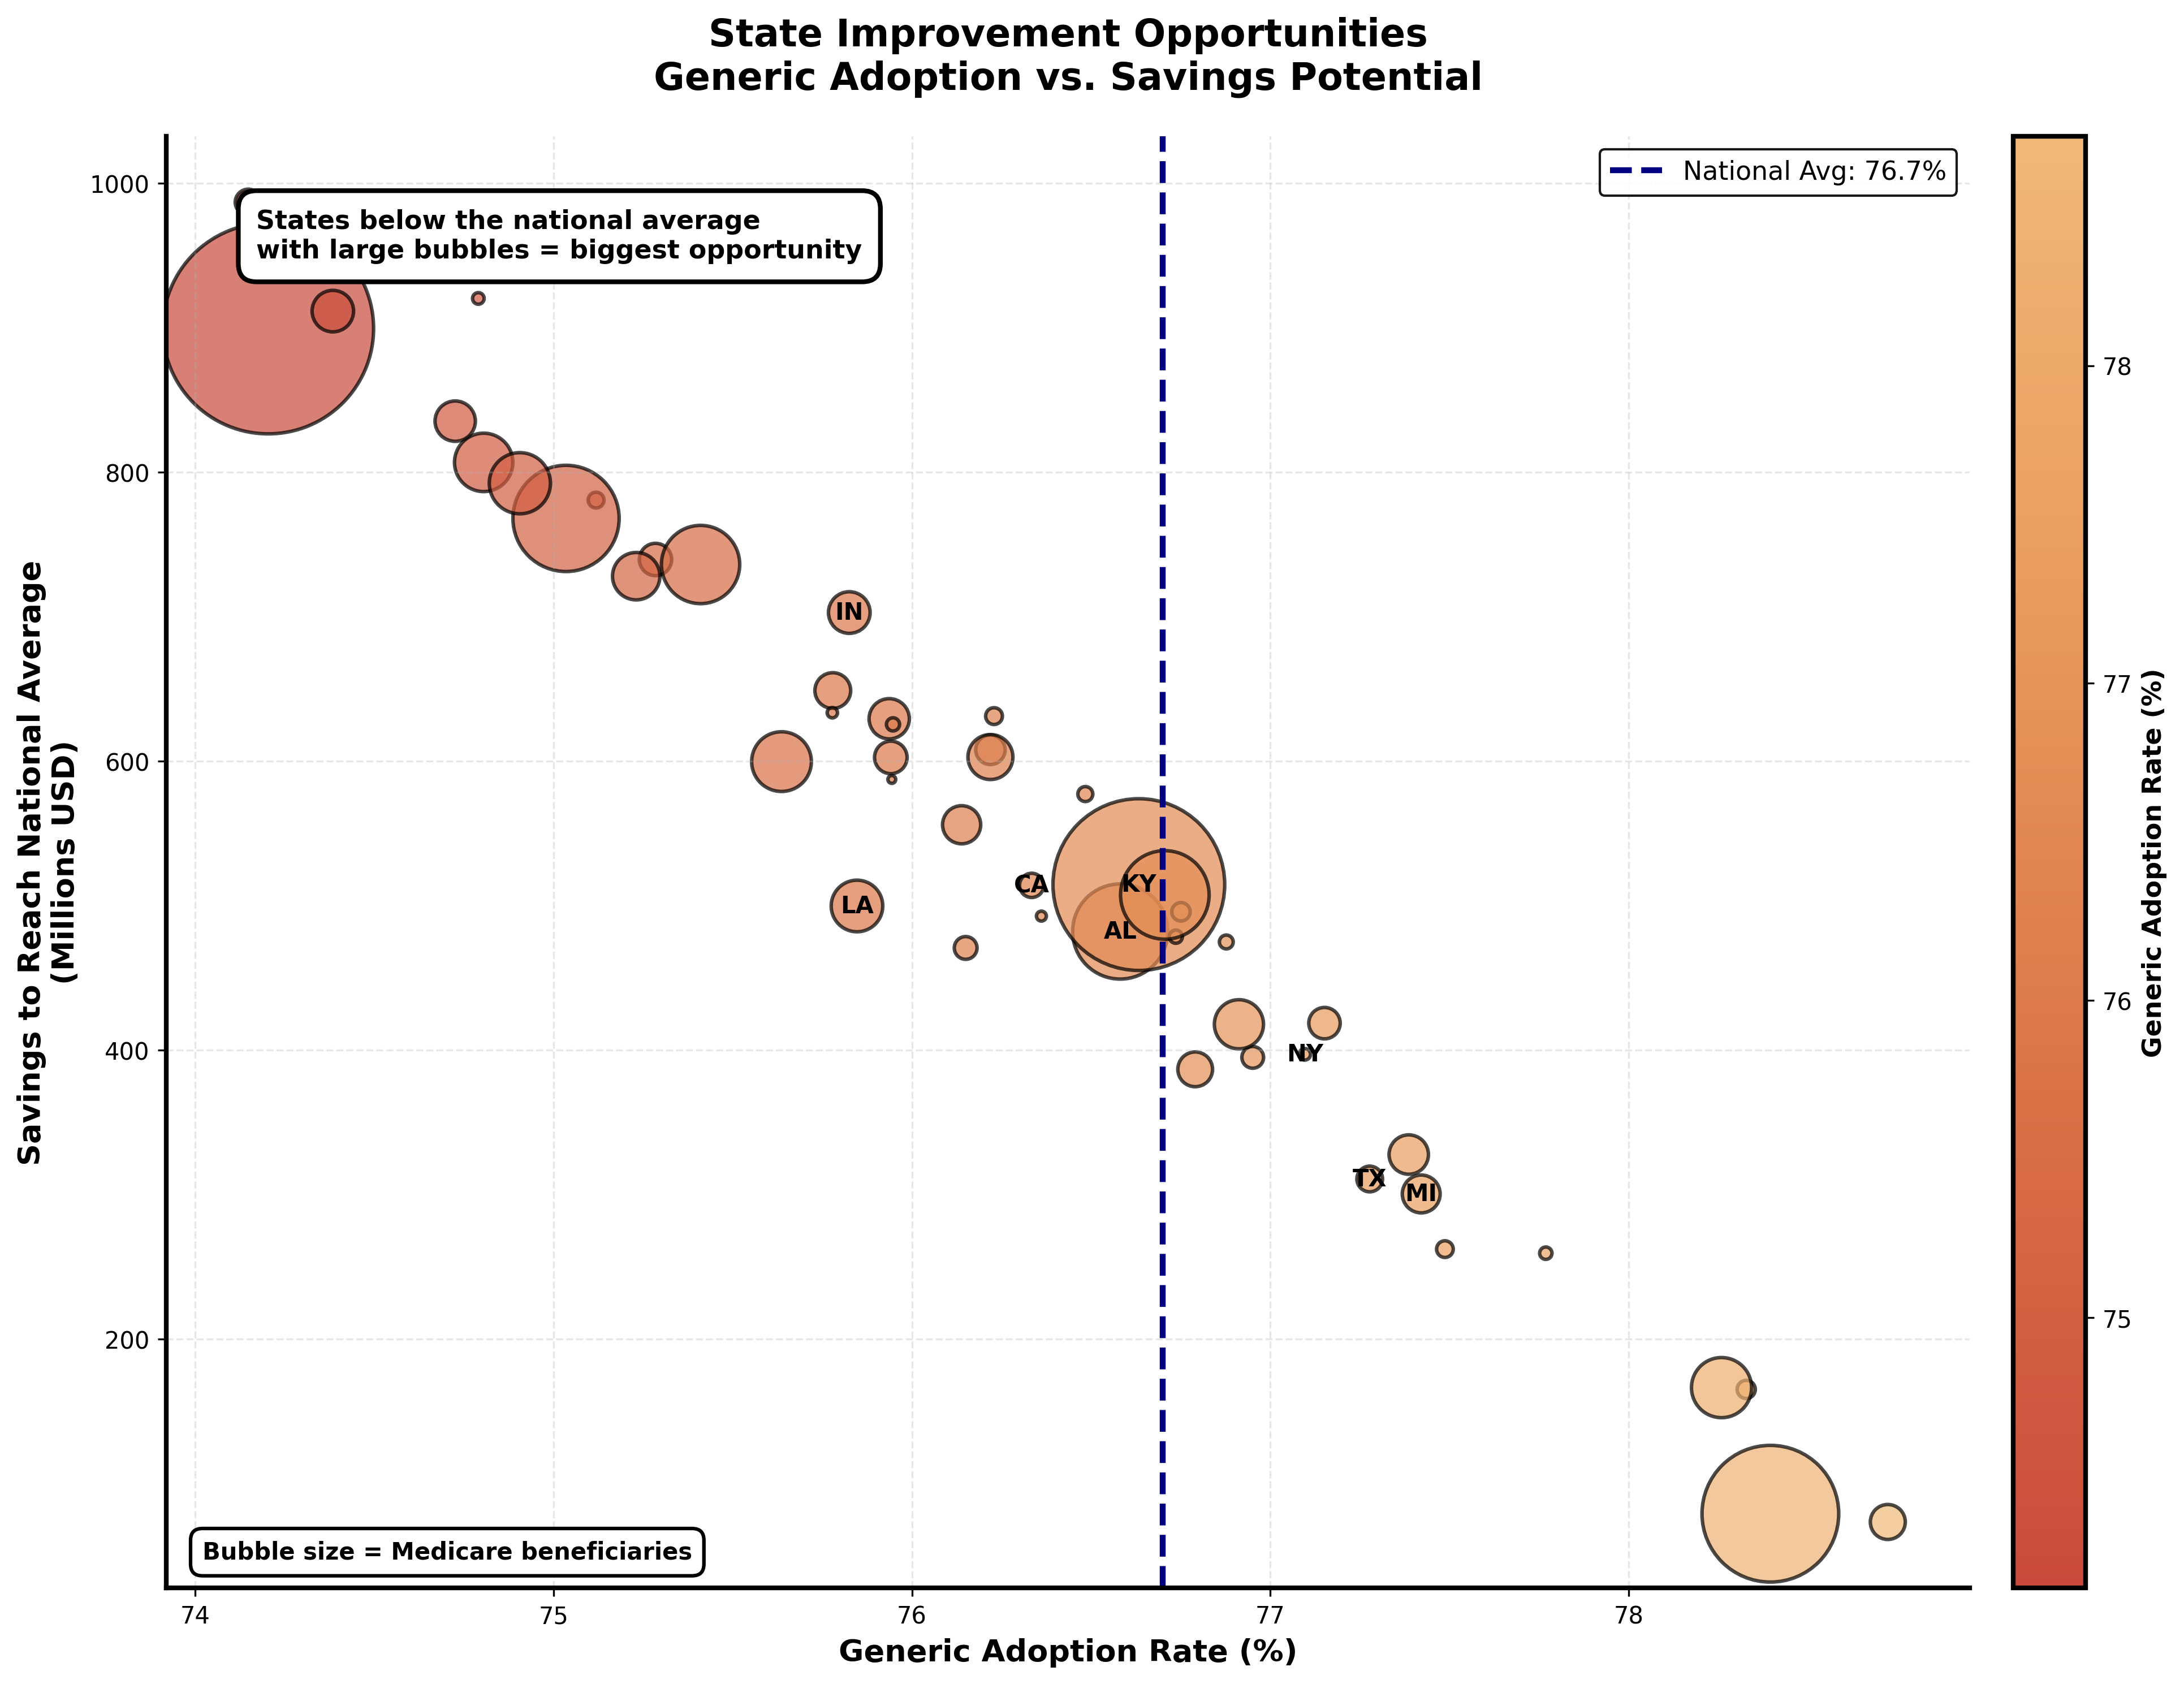
States plotted by generic adoption and savings potential. Large bubbles below the national average represent the biggest opportunities.

04

Five States Represent Over $2 Billion in Savings Opportunity

New York alone could save nearly $1 billion annually just by reaching the national average generic adoption rate. When combined with Indiana, Louisiana, California, and Kentucky, these five states represent massive concentrated opportunities for targeted intervention.

๐Ÿ’ก

Systemic Friction, Not Clinical Necessity, Drives Brand Use

From behind the pharmacy counter, I see the real barriers. When a prescription comes through for a brand name medication and I see a generic alternative, I can't just switch it. I need prescriber authorization. So I call the doctor's office.

Sometimes the medical assistant says "generic is fine" and we make the switch. Sometimes the doctor wants brand specifically. But often the response is "that's just what the doctor always writes." Or they don't return my call. The patient needs their medication now, so we fill the brand because that's what's on the prescription.

Multiply this by millions of prescriptions nationwide and you see how systemic friction, not clinical necessity, drives brand utilization.

The Path Forward

Target High Impact Medications

Focus immediate intervention on insulin and the top 10 medications by savings potential.

  • Provider education campaigns highlighting generic efficacy
  • Automatic substitution policies with clinical override
  • Patient education at point of prescription

Geographic Targeting

Pilot intensive interventions in underperforming states with large Medicare populations.

  • New York: $978M potential savings
  • Indiana: $258M potential savings
  • California: $222M potential savings

Prescriber Feedback Systems

Provide physicians with data driven insights on their prescribing patterns.

  • Generic prescription rate versus peers
  • Estimated patient cost savings
  • Clinical outcomes demonstrating equivalency
Savings Waterfall

Projected impact of 25% generic adoption improvement

Interactive Dashboard

Explore the data yourself using this interactive Tableau dashboard. Filter by state, medication, and cost metrics to understand how different factors affect savings potential.

Impact & Takeaways

For Policymakers

  • $885M from insulin alone justifies immediate policy intervention
  • Geographic targeting offers concentrated ROI in underperforming states
  • Systemic barriers are fixable with targeted prescriber and patient education

For Healthcare Systems

  • Generic substitution protocols could save billions system wide
  • Pharmacy level interventions show high potential for impact
  • Provider feedback systems work for changing prescribing behavior

For Patients

  • Ask your doctor about generic alternatives for every prescription
  • Geographic location affects your likelihood of receiving generics
  • Cost barriers to essential medications like insulin are solvable

Limitations & Future Work

This analysis uses 2023 Medicare Part D data and assumes clinical equivalency per FDA standards. Future work could incorporate:

  • Longitudinal analysis to track adoption trends over time
  • Prescriber level data to identify high brand preference providers
  • Patient outcome data to validate that generic substitution maintains quality of care
  • Socioeconomic factors that may influence both health outcomes and costs

Technical Implementation

Python Analysis

Used pandas for data manipulation, numpy for calculations, and matplotlib/seaborn for visualizations.

pandas numpy matplotlib seaborn

Data Processing

Aggregated 3GB raw dataset, calculated savings scenarios, engineered features for state and drug level analysis.

Feature Engineering Data Aggregation EDA

Visualization

Tableau Public for interactive dashboards. Python for static publication quality charts.

Tableau Data Visualization Dashboard Design